


In this blog, we will walk you through the process of creating a Power BI report based on airline tweet sentiment analysis. We will be using a dataset from Kaggle that contains tweets about different airlines and their sentiment. https://www.kaggle.com/datasets/crowdflower/twitter-airline-sentiment/code?resource=download
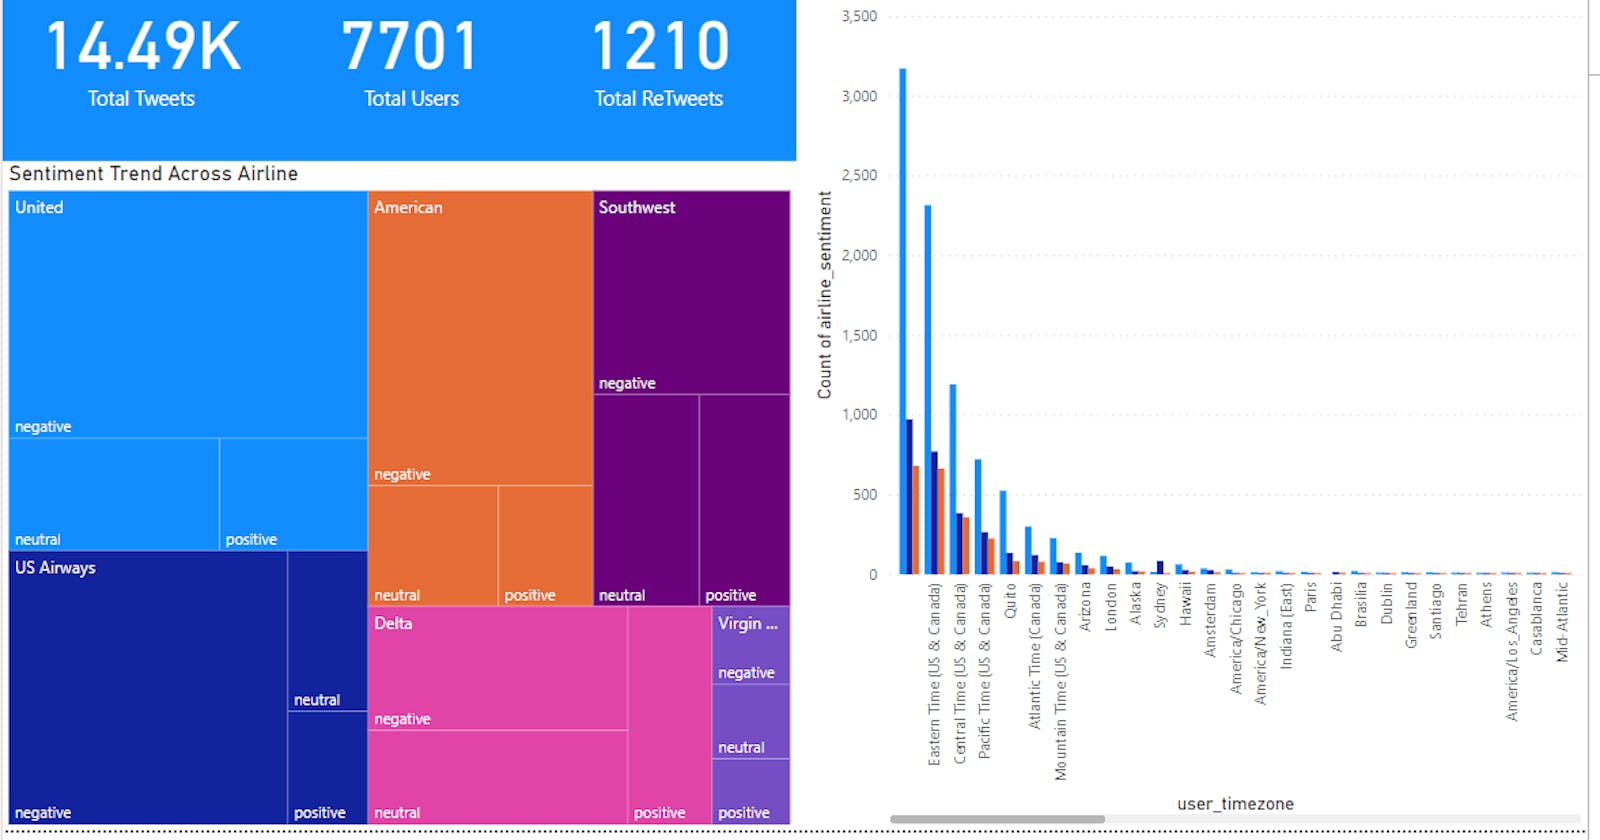
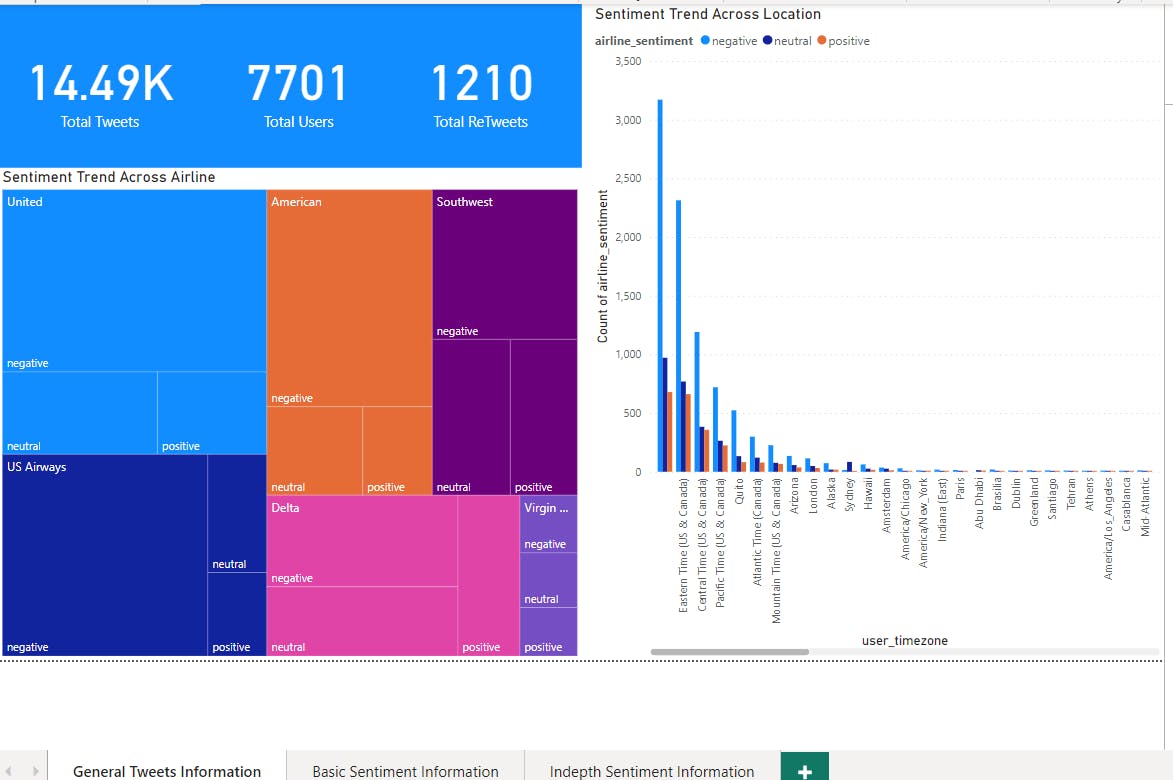
The first page of the Power BI report provides some basic information about the Airline Tweet Sentiment data, including the total number of tweets, users, and retweets.
A treemap visualization displays the distribution of tweets across different airlines.
A clustered column chart shows the number of tweets across various locations.
On the Second Page of our Power BI report on airline tweet sentiment analysis, we provide Basic Sentiment Tweets Information. The following charts are displayed:
Clustered Column Chart: This chart displays the count of tweets across Positive, Neutral, and Negative Sentiments, providing insights into the overall sentiment of tweets related to different airlines.
Pie Chart: This chart shows the distribution of tweets across different locations, allowing for a quick overview of the most active locations for tweeting about airlines.
Stacked Column Chart: This chart displays sentiment across different airlines, allowing for a comparison of the sentiment for each airline.

On the third page of the Power BI report based on airline tweet sentiment, there are several informative and visually appealing charts. These charts include:
A donut chart that displays sentiment information across different airlines.
A line chart that shows daily tweet trends for different sentiments.
A map that displays sentiment information of tweets across various locations.
A stacked column chart that displays information across sentiments of tweets across weekdays.
A funnel chart that provides information on positive tweet ratios across different sentiments. A measure was created for this chart using a specific formula.
COUNTROWS(FILTER('Tweets', Tweets[airline_sentiment]="positive"))

In conclusion, the Power BI report based on airline tweet sentiment analysis provides a comprehensive view of how customers feel about various airlines. With the help of interactive visuals and informative charts, the report allows airlines to identify areas where they can improve and optimize their customer service. By analyzing customer sentiment data, airlines can make data-driven decisions and take action to enhance their customer experience. The report also highlights the importance of data visualization and how it can help in better understanding complex data sets. Overall, Power BI is a powerful tool for analyzing and presenting data, and this report showcases the potential it has in the field of sentiment analysis.
You can access the pbix file for this report on my GitHub page at this link: Airline Tweet Sentiment Analysis Report.