

Behind the Scenes: Crafting a Data Jobs Market Analysis Report Using Power BI


In this blog, I will take you on a journey of how I created a report that analyzes the current job market for data professionals and the required skillset. To accomplish this, I utilized a sample dataset created by @LukeBarousse, which is freely available on Kaggle: kaggle.com/datasets/lukebarousse/data-analy...
The Power BI report that I developed is broken down into three distinct sections that provide users with a comprehensive overview of the job market, detailed job descriptions, and granular information about the required skills.
To build these sections, I had to engage in extensive data cleaning and preprocessing tasks, such as deleting unnecessary columns, creating ad-hoc hierarchies for drill-down visuals, and grouping different job titles into general categories like Data Analyst, Data Engineer, Data Scientist, and Others.
One crucial aspect of the report involved working with the skills column, which contained a list of skills for each job ID. To use this information, I had to split it across rows and create a distinct count of job IDs while taking count anywhere in the report, or else it would show inaccurate values.
To ensure the report provided the most valuable insights, I also had to create a table and rank column that helped me identify the top N features for the visuals. Overall, this report showcases how Power BI can be used to analyze and visualize data effectively, providing users with valuable insights into the job market's current state.
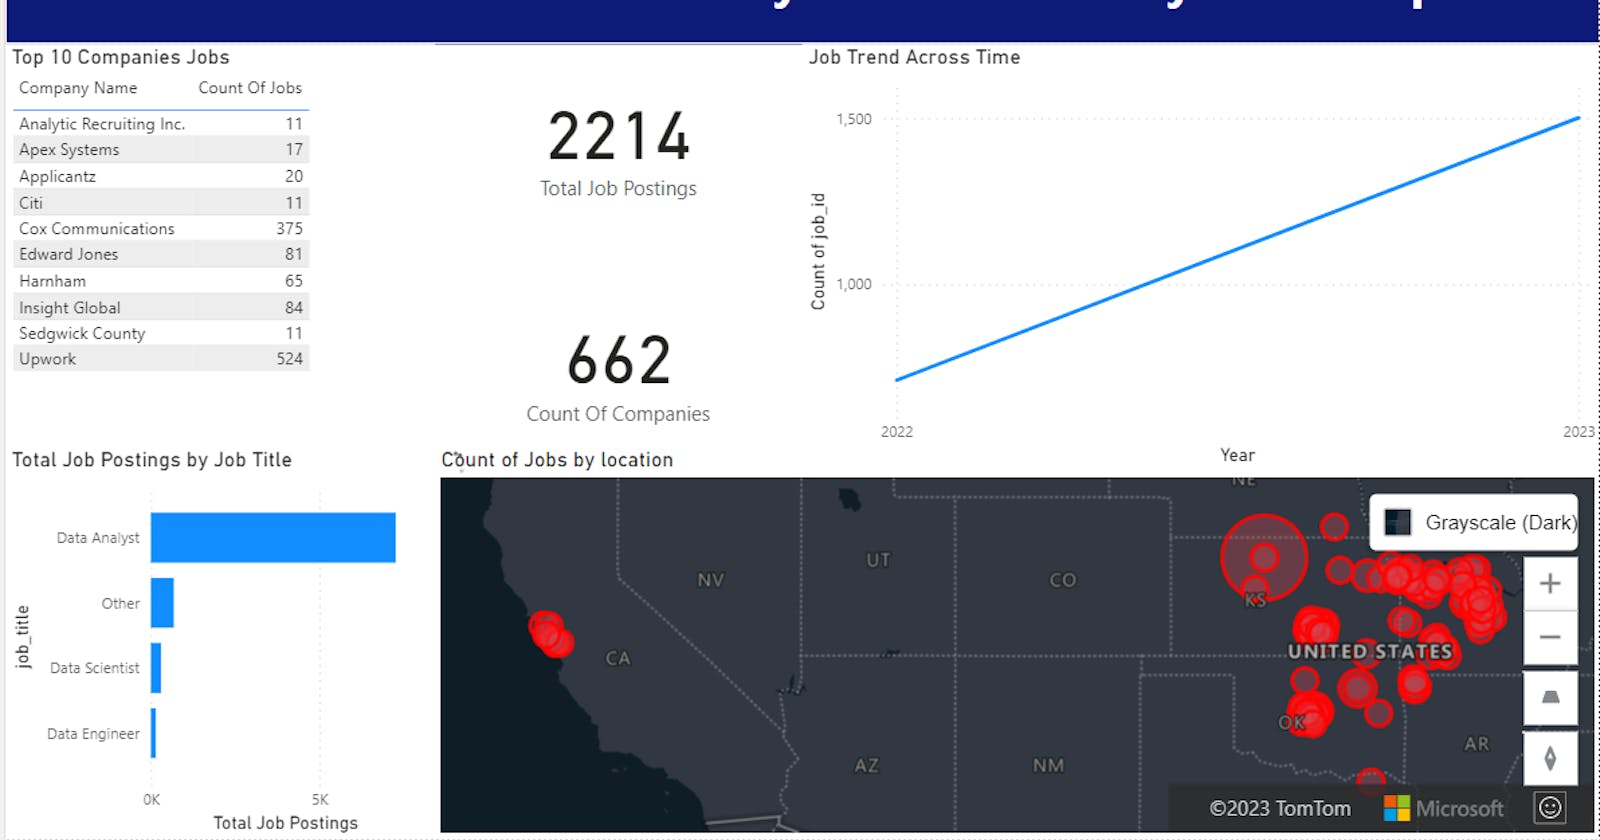
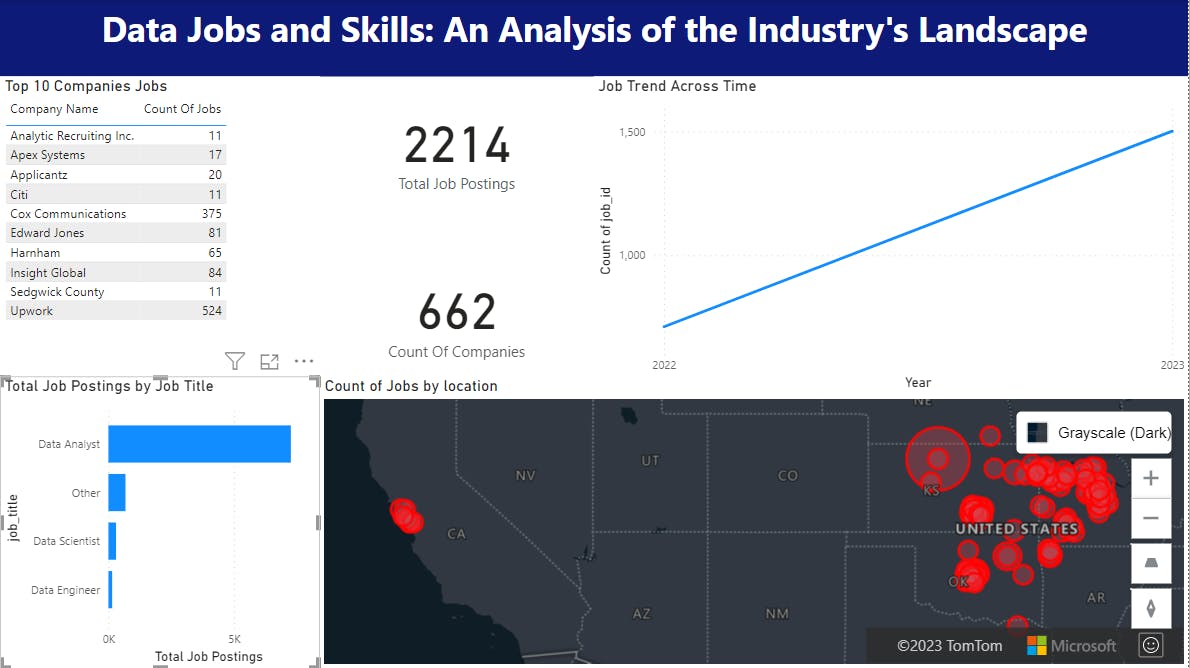
The Overview tab provides a summary of information for the dataset.
It shows the total number of job postings and companies that are included in the analysis.
A table is displayed to showcase the top 10 companies that offer data jobs.
A bar chart is used to represent the number of job postings by title.
A map is used to visually display the distribution of job locations.
The Details tab offers more comprehensive information, including:
The top skills required for each job title.
The number of jobs available for each skill.
The Salary Trend across various job titles.

The third tab of the report was specifically designed to showcase the powerful drill-down feature in Power BI. With this feature, users can easily explore data at different levels of granularity by expanding or drilling down into more detailed data.
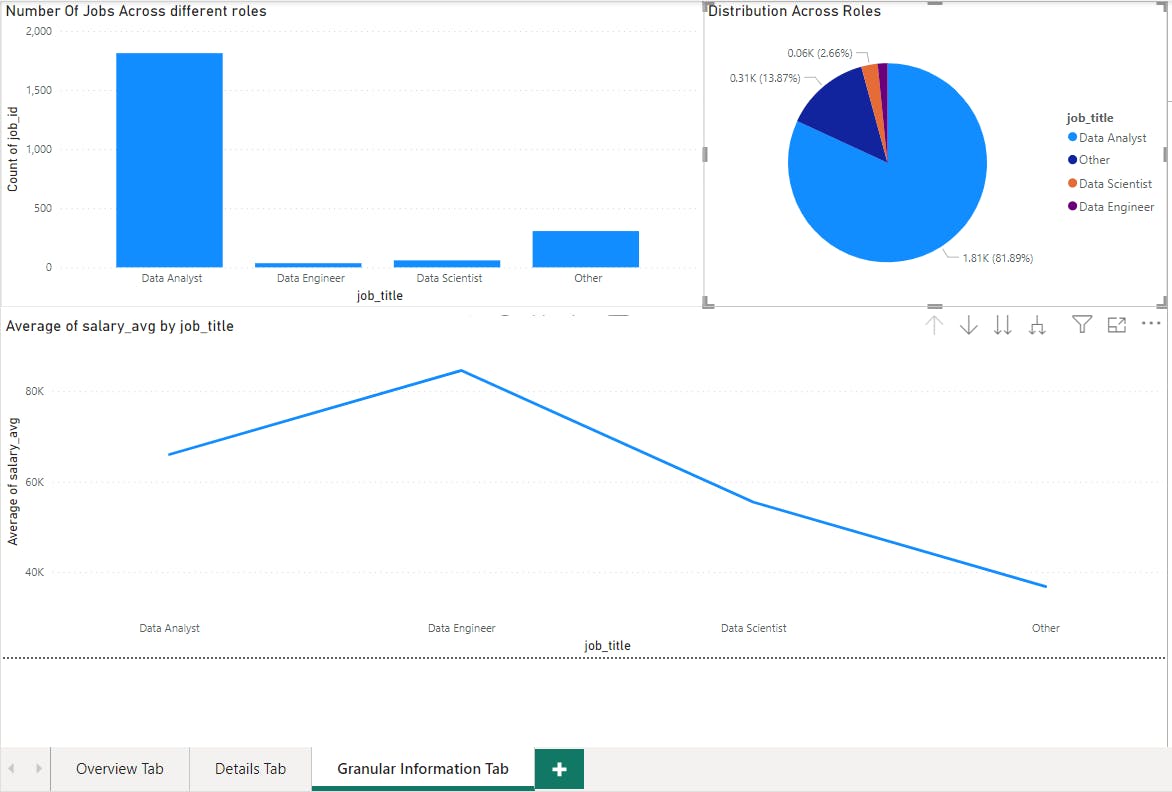
To enable the drill-down feature, I created two ad-hoc hierarchies as the original dataset did not have any existing hierarchies.
The first hierarchy was created between the skills and job title, while the second was between the job title and company name.
In this tab, I have used visuals that are similar to those in the Details tab, such as a column chart that displays the number of jobs across different roles. However, the drill-down feature has been implemented, allowing for a more detailed view and also interactivity
Column Chart: This chart displays the number of jobs available across different roles. However, the drill-down feature allows for a more detailed look at the distribution across the various companies offering these roles.

Pie Chart: Similar to the column chart, this pie chart also shows the distribution across roles. But, in this chart, users can dive deeper to explore the distribution across skills for each specific role.
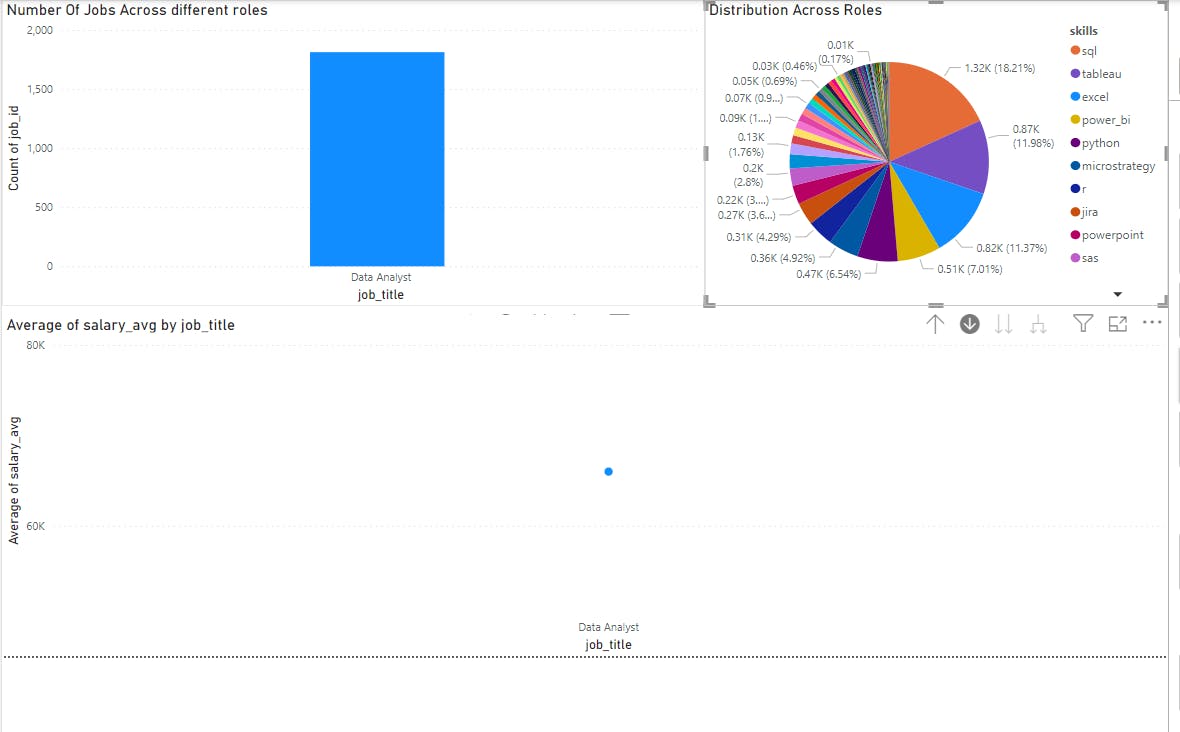
Line Chart: This chart highlights the average salary trend across roles. But, the drill-down feature allows users to explore the trends across different companies for each role.

Additionally, to further explore the findings of this report, there are a couple of potential next steps. Firstly, we could create a data pipeline using a tool like Apache Airflow to regularly update the report with new job posting data. Secondly, we could investigate how the grouping of different skills affects the salaries of data jobs. These avenues of exploration could provide even deeper insights into the job market for data-related roles.
In conclusion, this report presents an analysis of data jobs available in the market and the required skills, showcased through a Power BI report with three tabs. The report provides valuable insights into job trends, skill requirements, and salary trends for various roles. Furthermore, the report demonstrates the use of the drill-down feature in Power BI, which allows users to explore data at different levels of granularity. Finally, suggestions for further exploration include creating a data pipeline and exploring how grouping different skills affects salaries.
You can access the pbix file for this report on my GitHub page at this link: Data Job Analysis Report.